Project
Cyprotex
Classification
Scientific Data Charts, Graphs, UX/UI for data representation
Description
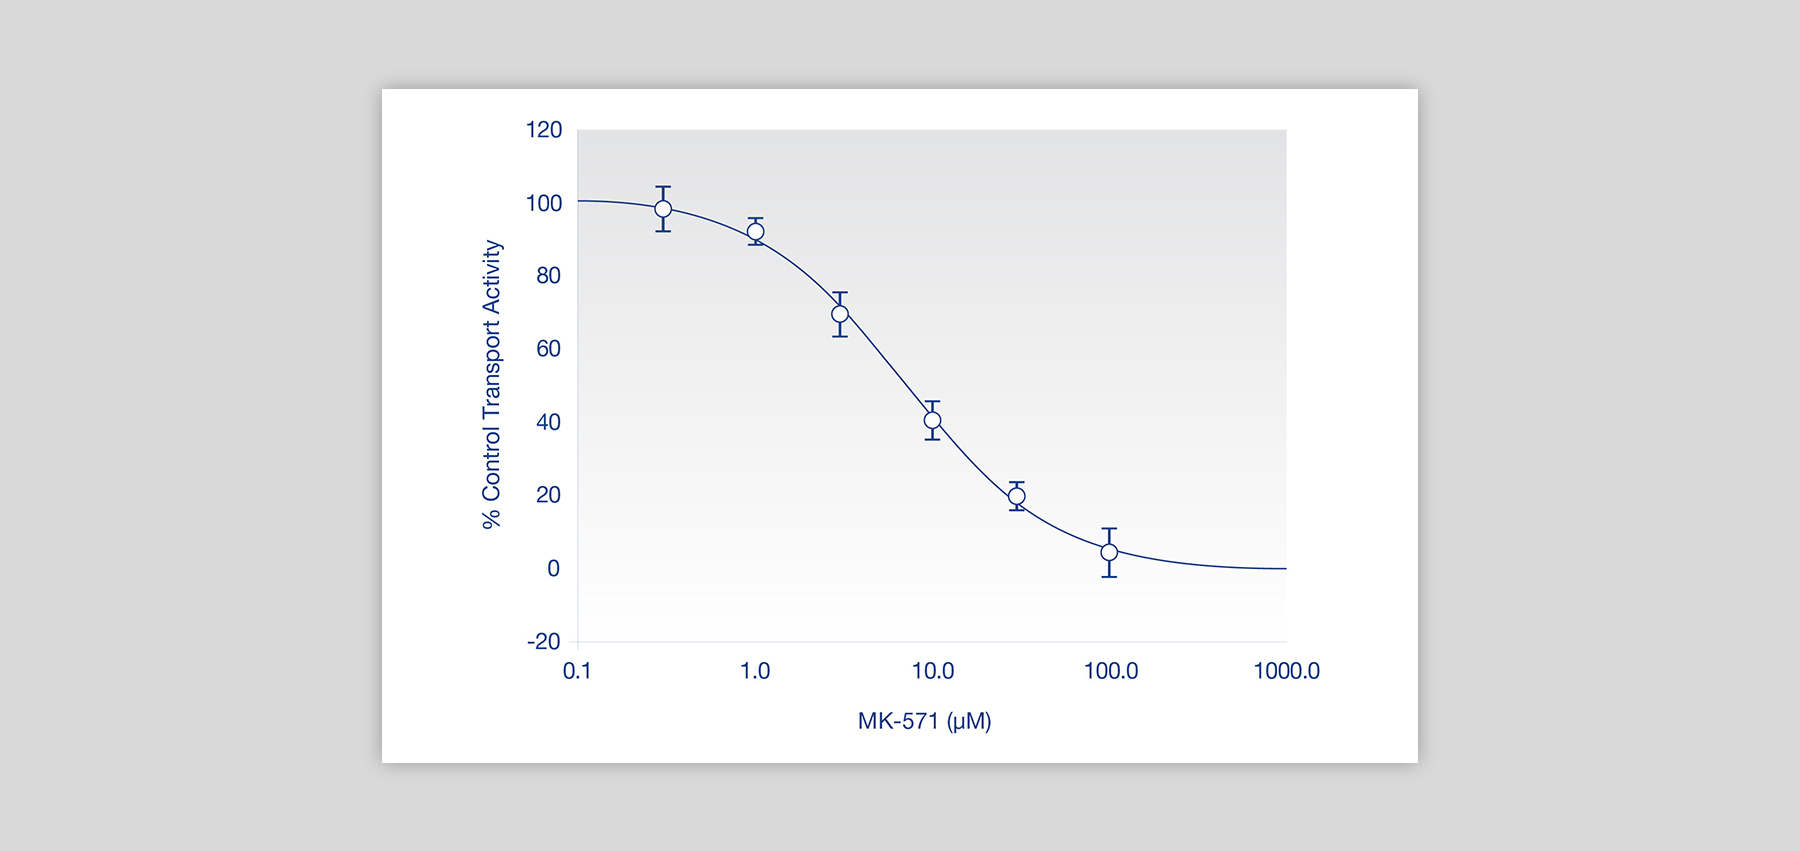
Designing and accurate representation of scientific data through branded charts and graphs for client Cyprotex, an industry leader in
in vitro and in silico ADME-Tox services. With a client like this, it’s important to get everything on the graphs absolutely spot on- so it’s legible, and can be read accurately.
This work is intended for web viewing, with the client, Cyprotex, publishing the data online in blogposts and articles.
Outcome
︎︎︎ Reactive Metabolite, Data
︎︎︎ DC Ratio Control, Data

︎︎︎ Reactive Metabolites

︎︎︎ Ratio of control in relationship to concentration